Retrieve Sensor Logs
In this tutorial, we will explain, step-by-step, how to use the Cybereason API to retrieve sensors logs and download them directly to your machine.
You must have the System Admin role to perform these reuqests.
When managing your organization’s sensors, you may need to retrieve sensor logs when troubleshooting sensor issues. You can use the Cybereason API to retrieve logs from a sensor or sensors.
Retrieve the logs
Note
The request body is the same regardless of how you run the request (such as a cURL command, in a REST API client, or Python script).
Ensure you log in to the Cybereason platform with the API. For details, see Log in with the API.
In your REST API client, open a new tab/file.
In the relevant field, enter the URL for the request:
https://<your server address>/rest/sensors/action/fetchLogs
For example, in Postman, you enter the URL here:

Ensure that the method for the request is set to POST. (This may be the default for your REST API client, but if not, ensure that you set it.)
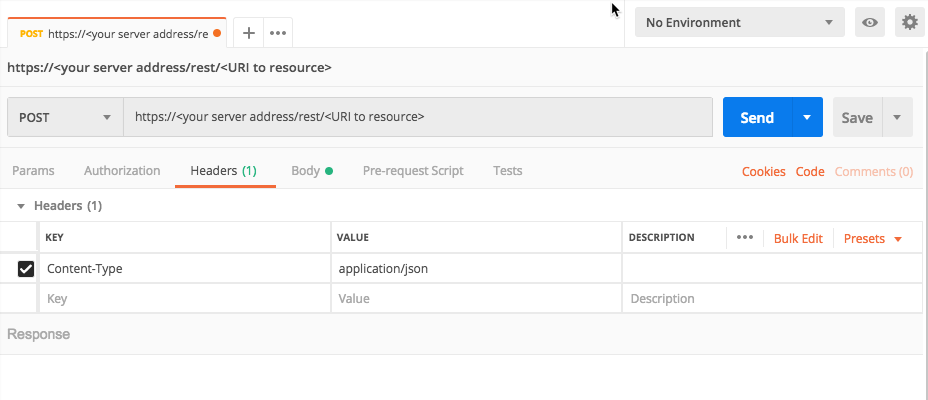
For the Headers, in the Key columnm, add a Content-Type header.
In the Value column, add the value application/json.
For example, in Postman, your header will look like this:
Navigate to the section to add your request body. In Postman, this is the Body tab.
In the Body tab, ensure that you have set your client editor to enable you to add JSON content. In Postman, for example, ensure that Raw is selected.
In the request body edit area, enter an open and closed bracket {}. This is the standard syntax for JSON.
You are now ready to begin adding the objects and key/value pairs that build the body.
Inside the brackets, add this template request body:
{
          "sensorsIds": [
              "<sensorID>"
          ]
      }
You will fill in this request part by part in the steps below.
To retrieve logs, you must specify the sensor or sensors from which to retrieve the logs. To do this, you must provide the unique sensor ID the Cybereason platform uses to identify the sensor. For details on how to retrieve the sensor ID with the API, see the Query Sensors API reference topic.
In the request body, in the sensorIds object, for the sensorID placeholder value 58ae74fae4b06dca39c1d4bc:PYLUMCLIENT_INTERNAL_CYBERSETUP7X64_005056A13A24 (a fictitious sensor ID).
Note
If you are using this tutorial to retrieve logs from a sensor in your production environment, you will need to update this value to the real sensor ID.
{
          "sensorsIds": [
              "**58ae74fae4b06dca39c1d4bc:PYLUMCLIENT_INTERNAL_CYBERSETUP7X64_005056A13A24**"
          ]
      }
In your client machine, run the request.
Your API client will display details on the operation to retrieve the logs.
{
    "batchId": 1268429474,
    "actionType": "FetchLog",
    "actionArguments": null,
    "globalStats": {
        "stats": {
            "FailedSending": 0,
            "InvalidState": 0,
            "ProbeRemoved": 0,
            "TimeoutSending": 0,
            "Pending": 0,
            "ChunksRequired": 0,
            "MsiFileCorrupted": 0,
            "SendingMsi": 0,
            "NewerInstalled": 0,
            "MsiSendFail": 0,
            "partialResponse": 0,
            "EndedWithSensorTimeout": 0,
            "FailedSendingToServer": 0,
            "GettingChunks": 0,
            "Aborted": 0,
            "Started": 0,
            "InProgress": 0,
            "Disconnected": 0,
            "Failed": 0,
            "Timeout": 0,
            "EndedWithTooManyResults": 0,
            "AlreadyUpdated": 0,
            "EndedWithTooManySearches": 0,
            "Succeeded": 0,
            "NotSupported": 0,
            "EndedWithUnknownError": 0,
            "None": 1,
            "Primed": 0,
            "EndedWithInvalidParam": 0,
            "UnknownProbe": 0,
            "AbortTimeout": 0,
            "UnauthorizedUser": 0
        }
    },
    "finalState": false,
    "totalNumberOfProbes": 1,
    "initiatorUser": "[email protected]",
    "startTime": 1523875331560,
    "aborterUser": null,
    "abortTime": 0,
    "abortTimeout": false,
    "abortHttpStatusCode": null
}
In this response body, you need to find the batchId value. You will use this value to download the logs in the next section.
Note
The request may fail if you use the fictitious sensor ID in this tutorial.
Download the logs
Note
The request body is the same regardless of how you run the request (such as a cURL command, in a REST API client, or Python script).
In your REST API client, open another tab/file.
In the relevant field, enter the URl for the request to download logs:
https://<your server address>/rest/sensors/action/download-logs/:batchID
Ensure that the method for the request is set to GET.
For the Headers, for the Key column, add a Content-Type header.
For the Value column, add the value application/json.
In this request, you do not have to add a request body since this request uses the GET method.
In the URL field, for the placeholder batchID value, add the batchID value from the previous section. For example, after you add the batch ID value to the URL, the URL for the request looks like this:
https://<your server address>/rest/sensors/action/download-logs/1268429474
Note
You will need to use a value for your own environment for the batchId value. Batch ID values are unique for each sensor operation performed in an environment.
Save the logs to your machine
Normally, when you send the request to download the logs, a REST API client will send the response as a jumbled set of characters (which represent binary code). In order to get the files (which are in a .zip file), you need to send and download the response.
Your API client will likely return the HTTP 200 status code, which indicates that the request is processed correctly by the server. However, unless you download the content of the response, you will not be able to retrieve and view the logs.
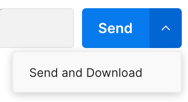
In your client, send the request using an option to also download the response body.
For example, in Postman, instead of simply clicking Send, you click the down arrow in the Send button and select Send and Download.
On your machine, navigate to the folder where logs download.
Unzip the archive file to view sensor logs.
Note
If you are using other frameworks to retrieve and download files (such as a script), you need ot add additional steps or methods to process the output from the server.
Next steps
Now that you understand how to retrieve and download sensor logs, you are ready to use the request body as part of your automation.