First Steps with Postman
You can use the API to help you automate or automatically perform a number of common Cybereason tasks. Follow the path described in this example to help you start working with the API by using the Postman API client.
You can download the Postman API client from Postman download site.
In this topic:
Step 1: Plan what you need to accomplish
In this example, we will retrieve data on all Sensors connected to a particular WebApp server.
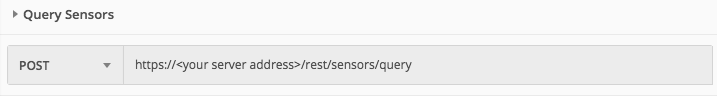
After checking the list of API endpoints, you can see we need the rest/sensors/query endpoint to retrieve this information.
Step 2: Log in with the API
Before you can send your request, you must log in to the platform via an API request.
In Postman, you do this via a separate request:
In the main window, open a new request.
In the URL bar, add the URL for the login page of your server: https://<your server address>/login.html.

In the Headers tab, add a type Content-Type with a value application/x-www-form-urlencoded.
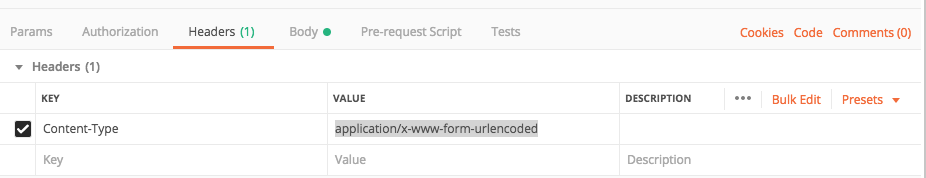
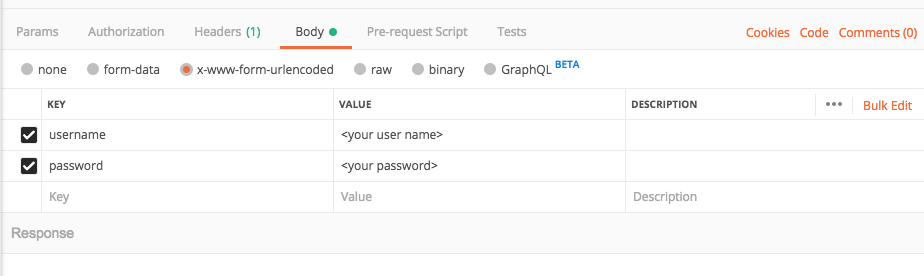
In the Body tab, ensure that the radio button ‘x-www-form-urlencoded’ is selected.

Still in the Body tab, add two additional keys for username and password. Set the values to your Cybereason username and password.
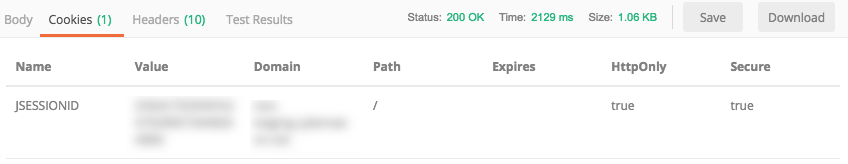
Click the Send button to send the request to your Cybereason server. When the platform successfully authenticates you, Postman displays the response and cookie information:
Step 3: Create your API request
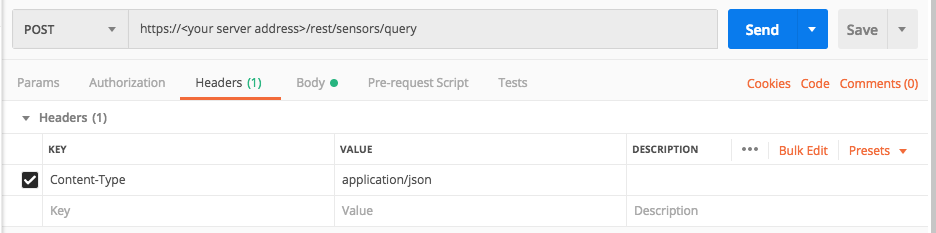
For each request, you open a separate tab. In the endpoint tab, you enter the following:
The full endpoint URL (not the URI)
The request headers. For all Cybereason API requests, you add a type Content-Type with the value application/json.
The request body. Enter the relevant information in the request body as specified in the API reference.
In our example, we need to provide the following information in the request body:
The sortDirection parameter. This enum value tells the Sensor to return the values in ascending ASC or descending DESC order.
The filter parameter. This parameter is an array which can include a number of other fields. In this example, we will use the osType field in the filter object parameter.
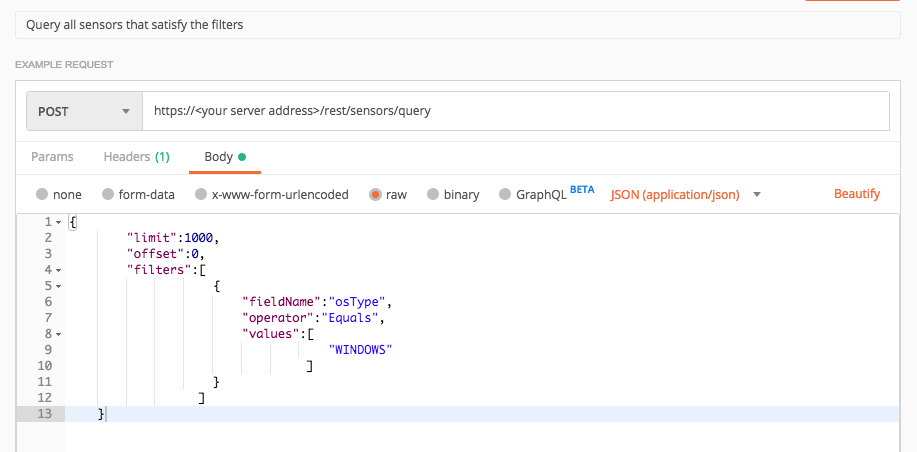
Add the information for these parameters and create the relevant cURL command, request body example, or Python script:
However, we want data on all our Windows Sensors, so we will add the details to filter for Windows Sensors. Therefore, the request body will look like this:
{
        "limit":1000,
        "offset":0,
        "filters":[
                                {
                                        "fieldName":"osType",
                                        "operator":"Equals",
                                        "values":[
                                                                "WINDOWS"
                                                         ]
                                }
                          ]
}
Step 4: Run the request
After you add the relevant details to the request, click the Send button send the request to your server.
The server will return a response with the request details.
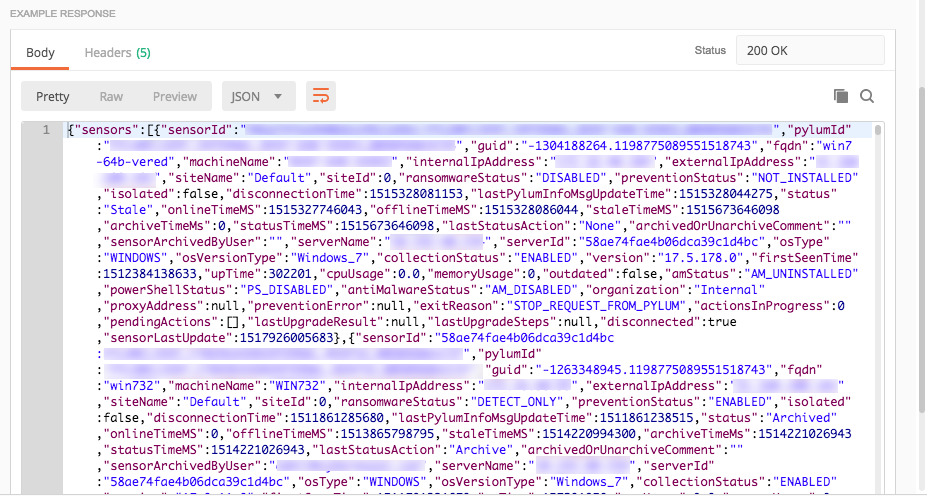
Step 5: Evaluate the response information
Once the platform has returned a response, view the details in the response for relevant data.
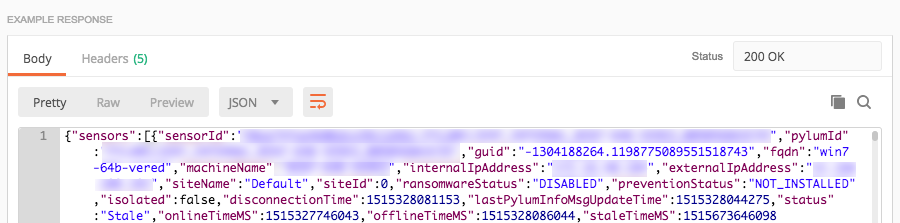
Most Cybereason API requests return a JSON body request containing numerous fields. You may want to use a JSON parser program to make the JSON syntax more readable. For example, use the option to view the JSON in the response as ‘pretty’:
For those requests that return CSV data, you can copy the CSV to a separate file and open that file in a separate program.
Sample Response
      {
  "sensors": [
    {
      "sensorId": "5ad31a2ce4b0e623bab9b9ae:PYLUMCLIENT_DEMO_DEMO1WIN7X64_005056AAA5F2",
      "pylumId": "PYLUMCLIENT_DEMO_DEMO1WIN7X64_005056AAA5F2",
      "guid": "-1869914237.1198775089551518743",
      "fqdn": "demo1win7x64",
      "machineName": "DEMO1WIN7X64",
      "internalIpAddress": "1.1.1.1",
      "externalIpAddress": "11.1.11.11",
      "siteName": null,
      "siteId": null,
      "ransomwareStatus": "DISABLED",
      "preventionStatus": "NOT_INSTALLED",
      "isolated": false,
      "disconnectionTime": 1523872923530,
      "lastPylumInfoMsgUpdateTime": 1523873136274,
      "status": "Online",
      "onlineTimeMS": 1523872959216,
      "offlineTimeMS": 1523872924216,
      "staleTimeMS": 0,
      "archiveTimeMs": 0,
      "statusTimeMS": 1523872959216,
      "lastStatusAction": "None",
      "archivedOrUnarchiveComment": "",
      "sensorArchivedByUser": "",
      "serverName": "12.34.56.78",
      "serverId": "5ad31a2ce4b0e623bab9b9ae",
      "osType": "WINDOWS",
      "osVersionType": "Windows_7",
      "collectionStatus": "ENABLED",
      "version": "17.6.10.0",
      "firstSeenTime": 1523872390812,
      "upTime": 184928,
      "cpuUsage": 0.016614608,
      "memoryUsage": 47464448,
      "outdated": false,
      "amStatus": "AM_UNINSTALLED",
      "powerShellStatus": "PS_DISABLED",
      "antiMalwareStatus": "AM_DISABLED",
      "organization": "demo",
      "proxyAddress": null,
      "preventionError": null,
      "exitReason": "STOP_REQUEST_FROM_PYLUM",
      "actionsInProgress": 0,
      "pendingActions": null,
      "lastUpgradeResult": null,
      "lastUpgradeSteps": null,
      "disconnected": false,
      "sensorLastUpdate": 1523873139215,
      "fullScanStatus": "UNKNOWN",
      "quickScanStatus": "UNKNOWN",
      "lastFullScheduleScanSuccessTime": 0,
      "lastQuickScheduleScanSuccessTime": 0
    }
  ],
  "totalResults": 1,
  "hasMoreResults": false,
  "sensorsStatus": {
    "onlineCount": 1,
    "offlineCount": 0,
    "staleCount": 0,
    "archivedCount": 0
  }
}
The fields available in the response differ from API. View your specific API reference topic to learn more about the fields contained in the response. In our example you may be interested in the values for a number of important fields:
sensorID field
Various Sensor protection statuses, like ransomwareStatus, preventionStatus, amStatus, or powerShellStatus
version field
osType field
When you are viewing the response information, there are a few general tips to help:
Ensure that you understand what to expect for your organization. For example, if you know what processes and addressed are used throughout your organization and what normal settings are for your Sensors, you can skip the expected items in the results and focus on the unexpected items.
Focus more on items that occur by themselves. In nearly all organizations, the same items and settings are used by multiple users and results return these items in large numbers. The results occurring in isolation warrant more of your attention.