Analyze the Response from an Investigation Query
In this tutorial, we will explain, step-by-step, how to analyze the data you receive in the resposne for an investigation query sent through the Cybereason API.
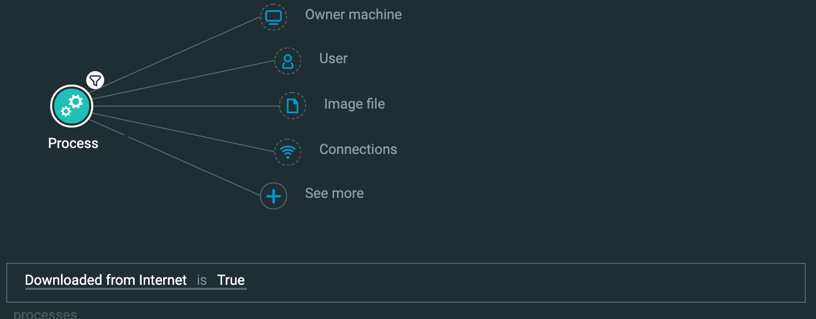
For the purposes of this tutorial, you will run a query to find processes downloaded from the Internet:
You must have the Analyst L1, L2, or L3 role to perform these requests.
When performing investigations, if you are running the same investigation query on a regular basis, it may be more efficient for you to automate the running of a query. The Cybereason API can help you automate the running of investigation queries. However, you also need to understand how to read and explain the results in the response.
In this topic:
Create and run the query
Note
The request body is the same regardless of how you run the request (such as a cURL command, in a REST API client, or Python script).
In your REST API client, open a new/tab file.
In the relevant fie,d, enter the URL for the request.
https://<your server address>/rest/visualsearch/query/simple
Ensure that the method for the request is set to POST. (This may be the default for your REST API client, but if not, ensure that you select it.)
For the Headers, in the Key column, add a Content-Type header.
In the Value column, add the value application/json.
Navigate to the section to add your request body. In Postman, for example, this is the Body tab.
In the request body edit area, enter an open and closed bracket {}. This is the standard syntax for JSON.
In the brackets, add this request body:
{
        "queryPath": [
          {
            "requestedType": "Process",
            "filters": [
              {
                "facetName": "isDownloadedFromInternet",
                "values": [
                  true,
                ],
                "filterType": "Equals"
              }
            ],
            "isResult": "true",
          }
        ],
        "templateContext": "SPECIFIC",
        "totalResultLimit": "1000",
        "perGroupLimit": "100",
        "perFeatureLimit": "100",
        "queryTimeout": "120000",
        "customFields": [
          "elementDisplayName",
          "calculatedName",
          "commandLine"
        ]
}
In your client machine, run the request.
View the query respnose object
After you run the query, you will receive a response with multiple different keys and values:
{
     "data": {
       "resultIdToElementDataMap": {
         "-2046359355.-446319856563366924": {
           "simpleValues":
   {
   "commandLine":
   {
   "totalValues":1,
   "values":["\"vnc02.exe\""]
   }
   ,"calculatedName":{
   "totalValues":1,
   "values":["VNC"]
   },
   "elementDisplayName":{
   "totalValues":1,
   "Values":["vnc02.exe"]
      }
                     }
           "elementValues": {
             "calculatedUser": {
               "totalValues": 1,
               "elementValues": [
                 {
                   "elementType": "User",
                   "guid": "0.-6313743191401684913",
                   "name": "mydomain\\mark",
                   "hasSuspicions": false,
                   "hasMalops": false
                 }
               ],
               "totalSuspicious": 0,
               "totalMalicious": 0
             },
             "parentProcess": {
               "totalValues": 1,
               "elementValues": [
                 {
                   "elementType": "Process",
                   "guid": "-2046359355.-7870067516287985870",
                   "name": "cmd.exe",
                   "hasSuspicions": false,
                   "hasMalops": false
                 }
               ],
               "totalSuspicious": 0,
               "totalMalicious": 0
             }
           },
           "suspicions": {
             "blackListFileSuspicion": 1512300804528
           },
           "filterData": {
             "sortInGroupValue": "-2046359355.-446319856563366924",
             "groupByValue": "ransomfreetest.exe"
           },
           "isMalicious": true,
           "suspicionCount": 1,
           "guidString": "-2046359355.-446319856563366924",
           "labelsIds": null,
           "malopPriority": null
         }
       },
       "suspicionsMap": {
         "dualExtensionSuspicion": {
           "potentialEvidence": [
             "dualExtensionNameEvidence",
             "hiddenFileExtensionEvidence",
             "rightToLeftFileExtensionEvidence",
             "masqueradingAsMovieEvidence"
           ],
           "firstTimestamp": 1516033781024,
           "totalSuspicions": 1
         },
         "blackListModuleSuspicion": {
           "potentialEvidence": [
             "blackListModuleEvidence"
           ],
           "firstTimestamp": 1512314218832,
           "totalSuspicions": 1
         },
         "ransomwareByCanaryFilesSuspicion": {
           "potentialEvidence": [
             "ransomwareByCanaryFilesEvidence"
           ],
           "firstTimestamp": 1512313571594,
           "totalSuspicions": 1
         },
         "connectingToBadReputationAddressSuspicion": {
           "potentialEvidence": [
             "hasMaliciousConnectionEvidence"
           ],
           "firstTimestamp": 1516033781024,
           "totalSuspicions": 1
         }
       },
       "evidenceMap": {},
       "totalPossibleResults": 13,
       "queryLimits": {
         "totalResultLimit": 1000,
         "perGroupLimit": 100,
         "perFeatureLimit": 100,
         "groupingFeature": {
           "elementInstanceType": "Process",
           "featureName": "imageFileHash"
         },
         "sortInGroupFeature": null
       },
       "queryTerminated": false,
       "pathResultCounts": [
         {
           "featureDescriptor": {
             "elementInstanceType": "Process",
             "featureName": null
           },
           "count": 13
         }
       ]
     },
     "status": "SUCCESS",
     "message": ""
   }
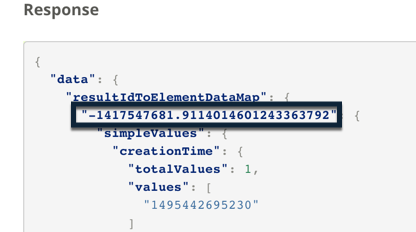
To find each individual results instance, you need to locate the results GUID. The results GUID is a multi-digit number the cybereason platform uses to identify the specific instance (process, machine, etc.)
View Feature details
For each query, you specify a target Element (using the isResult key). Then, in the response, the Cybereason platform returns relevant details for that Element type.
To view Features related to your target Element, you need to locate the simpleValues object.
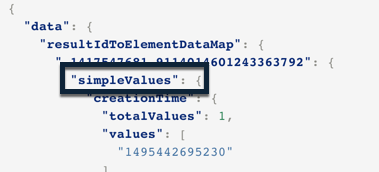
Inside the simpleValues object, there are separate entries for each relevant feature:
{
      "simpleValues":
   {
      "commandLine":
                     {
                        "totalValues":1,
                        "values":["\"vnc02.exe\""]
                     }
   ,"calculatedName":{
                        "totalValues":1,
                        "values":["VNC"]
                     },
   "elementDisplayName":{
                           "totalValues":1,
                           "Values":["vnc02.exe"]
                        }
   }
}
In this example, the relevant Features in the simpleValues object are the commandLine, calculatedName, and elementDisplayName Features.
Inside each object for these specific Features, view the totalValues key (which will usually be 1) and the values to understand the Feature valuds for this results instance.
View Element details
In addition to details about Features related to the target Element for each results instance, you can see information on associated Elements. This includes details on machines, users, connections, processes, and so forth, related to the specific results instance.
To view these related Elements, you need to locate the elementValues object:
{
   "elementValues": {
                      "calculatedUser": {
                        "totalValues": 1,
                        "elementValues": [
                          {
                            "elementType": "User",
                            "guid": "0.-6313743191401684913",
                            "name": "mydomain\\mark",
                            "hasSuspicions": false,
                            "hasMalops": false
                          }
                        ],
                        "totalSuspicious": 0,
                        "totalMalicious": 0
                      },
                      "parentProcess": {
                        "totalValues": 1,
                        "elementValues": [
                          {
                            "elementType": "Process",
                            "guid": "-2046359355.-7870067516287985870",
                            "name": "cmd.exe",
                            "hasSuspicions": false,
                            "hasMalops": false
                          }
                        ],
                        "totalSuspicious": 0,
                        "totalMalicious": 0
                      }
                    }
}
In this example, you can see that there is a User (represented with the calculatedUser Feature) and a Process (represented with the parentProcess Feature) associated with this specific procees result instance.
Inside the object for each associated Element, you can see the guid and name for the associated Element. Use this information to learn more.
View other details
There are also a number of other keys and values to investigate further.
You can view suspicions associated with the result instance in the suspicions object:
"suspicions": {
                "blackListFileSuspicion": 1512300804528
              }
You can also see related suspicions and evidence in the suspicionsMap and evidenceMap objects:
"suspicionsMap": {
   "dualExtensionSuspicion": {
     "potentialEvidence": [
       "dualExtensionNameEvidence",
       "hiddenFileExtensionEvidence",
       "rightToLeftFileExtensionEvidence",
       "masqueradingAsMovieEvidence"
     ],
     "firstTimestamp": 1516033781024,
     "totalSuspicions": 1
   },
   "blackListModuleSuspicion": {
     "potentialEvidence": [
       "blackListModuleEvidence"
     ],
     "firstTimestamp": 1512314218832,
     "totalSuspicions": 1
   },
   "ransomwareByCanaryFilesSuspicion": {
     "potentialEvidence": [
       "ransomwareByCanaryFilesEvidence"
     ],
     "firstTimestamp": 1512313571594,
     "totalSuspicions": 1
   },
   "connectingToBadReputationAddressSuspicion": {
     "potentialEvidence": [
       "hasMaliciousConnectionEvidence"
     ],
     "firstTimestamp": 1516033781024,
     "totalSuspicions": 1
   }
 }
Next steps
Now that you understand how to read the response for a query, you can start building scripts to parse and extract the details in the response.