Find Indicators of Suspicious Behavior - Advanced Example
This topic provides a step by step example of how you can use the API to perform investigation queries for indicators of suspicion behaviors. In this example, we will search for all process connections, but also exclude processes that are browser processes or peer-to-peer (P2P) processes. This is a useful query to use to find examples of strange connections in your organization, since you filter out the connections used by applications in your organization (such as browsers or peer-to-peer communication tools)
While this example uses specific indicators, you can easily substitute any Element and its relevant Feature (filter) for your own queries. Conversely, you can also add a filter to the Connection Element if you know of a specific malicious address that users should not be using.
In this topic:
Step 1: Plan your queries
To create queries that return meaningful results, you must plan your queries carefully:
Enumerate in a general way what you want to find, such as computers or processes.
Determine the indicators you will use to identify your target, such as a specific operating system. Write an explicit statement of your query.
For detailed documentation on planning and building your queries, see the Hunting and Investigation documentation in the Cybereason core documentation.
In this example, we want to search for process connections that are not from browser or peer-to-peer applications.
Based on this, we can write the following statement: I want to view details on connections opened from processes that are not a browser or a peer-to-peer application.
Step 2: Build your queries in the Investigation screen
A query in the Investigation screen has two parts:
Elements are the objects you want to find, or the computing component parts of the your statement.
Features, or filters, are the indicators that identify the target.
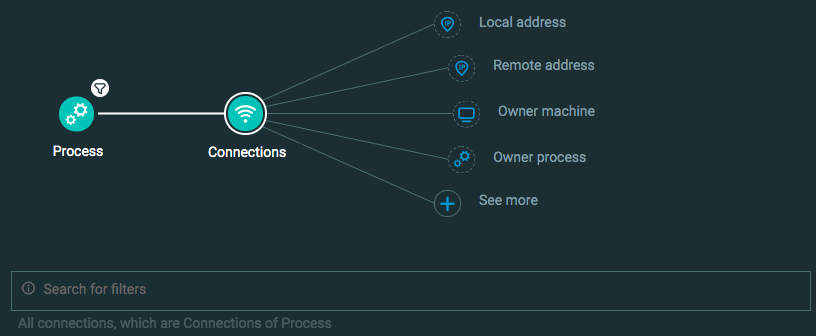
In this example, you build this query:
Process Element
Add a filter on the Process Element for Product Type IS NOT Browser or P2P
Connection Element
Step 3: Run your queries and copy the request body
In Chrome, open Chrome DevTools.
In the Cybereason Investigation screen, click Get results.
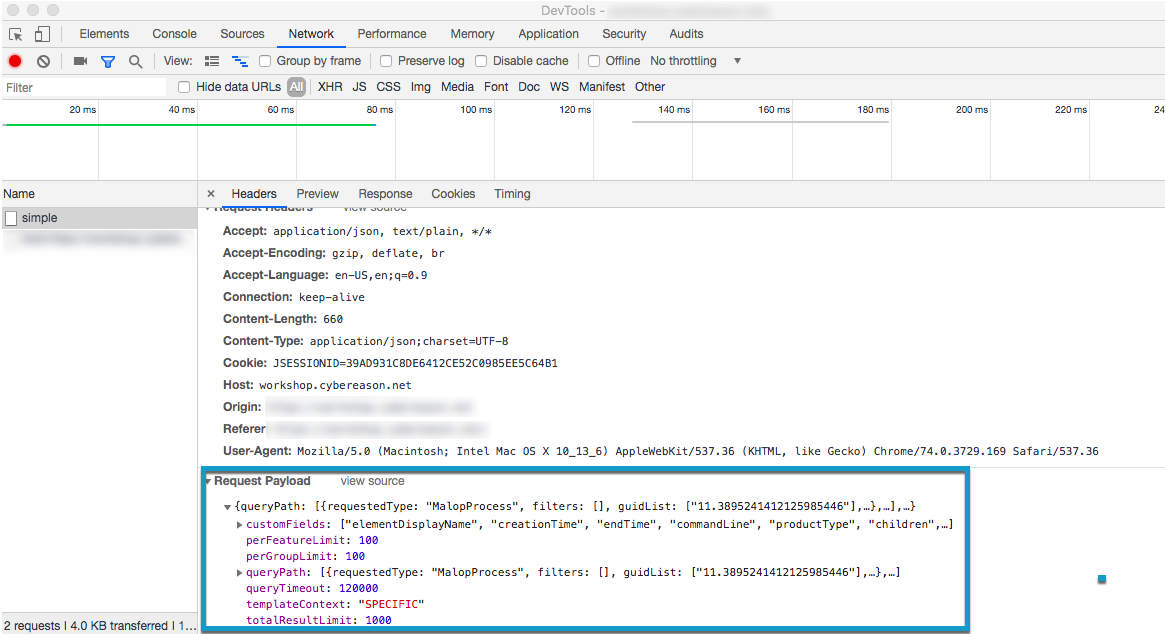
After the query has finished running, select the Network tab in Chrome DevTools, and then select the relevant request.
In the Request Payload section in the lower part of the window, copy the entire request payload. You will use this in the request body for API request.
Step 4: Build the API request
Use the relevant cURL commmand, request body example, or Python script.
In this example, we are using a stand-in address for a Cybereason server (myserver.com). If you use this request, replace this address with your actual server address.
All Python examples are formatted for Python version 3.0 and higher, up to the latest Python version. If you are using versions of Python earlier than 3.0, ensure you manually remove parentheses for the print statements in this sample. For example, the print (response.content) statement updates to print response.content.
curl --request POST \
          --url https://myserver.com/rest/visualsearch/query/simple \
          --header 'Content-Type: application/json' \
          --data '{
                    "queryPath":[
                                  {
                                    "requestedType":"Process",
                                    "filters":[
                                                {
                                                  "facetName":"productType",
                                                  "values":["BROWSER","P2P"],
                                                  "filterType":"NotEquals"
                                                }
                                              ],
                                    "connectionFeature":{
                                                          "elementInstanceType":"Process",
                                                          "featureName":"connections"
                                                        }
                                  },
                                  {
                                    "requestedType":"Connection",
                                    "filters":[],
                                    "isResult":true
                                  }
                                ],
                    "totalResultLimit":1000,
                    "perGroupLimit":100,
                    "perFeatureLimit":100,
                    "templateContext":"SPECIFIC",
                    "queryTimeout":120000,
                    "customFields":[
                                    "elementDisplayName",
                                    "direction",
                                    "ownerMachine",
                                    "ownerProcess",
                                    "serverPort",
                                    "serverAddress",
                                    "portType",
                                    "aggregatedReceivedBytesCount",
                                    "aggregatedTransmittedBytesCount",
                                    "remoteAddressCountryName",
                                    "dnsQuery",
                                    "accessedByMalwareEvidence",
                                    "calculatedCreationTime",
                                    "endTime"
                                   ]
                  }'
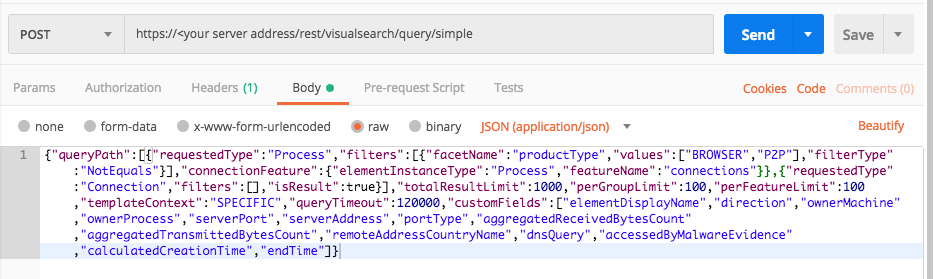
Use this request body:
Depending on your browser settings, this linked file may open in a separate tab instead of downloading directly to your machine. If this happens, use the Save As option in your browser to save the file locally.
{
              "queryPath": [
                {
                  "requestedType": "Process",
                  "filters": [
                    {
                      "facetName": "productType",
                      "values": [
                        "BROWSER",
                        "P2P"
                      ],
                      "filterType": "NotEquals"
                    }
                  ],
                  "connectionFeature": {
                    "elementInstanceType": "Process",
                    "featureName": "connections"
                  }
                },
                {
                  "requestedType": "Connection",
                  "filters": [],
                  "isResult": true
                }
              ],
              "totalResultLimit": 1000,
              "perGroupLimit": 100,
              "perFeatureLimit": 100,
              "templateContext": "SPECIFIC",
              "queryTimeout": 120000,
              "customFields": [
                "elementDisplayName",
                "direction",
                "ownerMachine",
                "ownerProcess",
                "serverPort",
                "serverAddress",
                "portType",
                "aggregatedReceivedBytesCount",
                "aggregatedTransmittedBytesCount",
                "remoteAddressCountryName",
                "dnsQuery",
                "accessedByMalwareEvidence",
                "calculatedCreationTime",
                "endTime"
              ]
            }
Depending on your browser settings, this linked file may open in a separate tab instead of downloading directly to your machine. If this happens, use the Save As option in your browser to save the file locally.
import requests
import json

# Login information

username = "[email protected]"
password = "mypassword"
server = "yourserver.com"
port = "443"

data = {
    "username": username,
    "password": password
}

headers = {"Content-Type": "application/json"}

base_url = "https://" + server + ":" + port

login_url = base_url + "/login.html"

session = requests.session()

login_response = session.post(login_url, data=data, verify=True)

print (login_response.status_code)
print (session.cookies.items())

# Request URL

endpoint_url = "/rest/visualsearch/query/simple"

api_url = base_url + endpoint_url

# These are the variables that represent different fields in the request.

query_element_1 = "Process"
query_element_1_filter_1 = "productType"
query_element_1_filter_1_value_1 = "BROWSER"
query_element_1_filter_1_value_2 = "P2P"
linking_element = "Process"
linking_feature = "connections"
query_element_2 = "Connection"

query = json.dumps({"queryPath":[{"requestedType":query_element_1,"filters":[{"facetName":query_element_1_filter_1,"values":[query_element_1_filter_1_value_1,query_element_1_filter_1_value_2],"filterType":"NotEquals"}],"connectionFeature":{"elementInstanceType":linking_element,"featureName":linking_feature}},{"requestedType":query_element_2,"filters":[],"isResult":True}],"totalResultLimit":1000,"perGroupLimit":100,"perFeatureLimit":100,"templateContext":"SPECIFIC","queryTimeout":120000,"customFields":["elementDisplayName","direction","ownerMachine","ownerProcess","serverPort","serverAddress","portType","aggregatedReceivedBytesCount","aggregatedTransmittedBytesCount","remoteAddressCountryName","dnsQuery","accessedByMalwareEvidence","calculatedCreationTime","endTime"]})

api_headers = {'Content-Type':'application/json'}

api_response = session.request("POST", api_url, data=query, headers=api_headers)

your_response = json.loads(api_response.content)

print(json.dumps(your_response, indent=4, sort_keys=True))
Step 5: Run your request and generate the response
In the command line, REST API client, or IDE, run the command or script that contains the request. After a few seconds, the Cybereason API returns a response.
Step 6: View the response details
The response contains a large number fields. Focus on these fields for meaningful information: